
Industrial energy operations
powered by AI
Monitor electricity, HVAC, fuel, water, and heating in one platform — then act on AI findings with dashboards, alerts, and reports.
Built for plant managers, energy engineers, and operations teams who need clearer decisions from their facility data.
How Jaghleh works
The big picture — from your site to clearer decisions.
Connect your site
Bring your factory systems into Jaghleh — electricity, HVAC, fuel, water, and heating in one place.
See what is happening
Live dashboards show consumption, demand, and how energy moves across zones and equipment.
Act on insights
Ask AI, get alerts, and receive reports so your team can cut waste and avoid downtime.
What Jaghleh stands for
The name is our operating principle — how we design the platform and work with industrial energy teams.
Principle of fairness and transparency at work.
Flexibility to fit any environment.
Commitment to sustainability.
Supports multiple energy, utility, or system setups.
Smarter flows of energy, goods, and data.
Extracting maximum value with minimum waste.
A central decision and monitoring platform.
What you get with Jaghleh
Monitor electricity, HVAC, fuel, water, and heating — then analyze, alert, report, and act.
More than electricity
Monitor electricity alongside HVAC, fuel, water, and heating — one hub for the utilities that keep your facility running.
Live factory energy ops
Site overview with today’s KPIs, power flow, top consumers, zone balance, and per-device deep dives your operations team can act on.
Jaghleh Book
Proactive AI issue cards with evidence and recommended actions. Assign, resolve, and follow up so findings become operational work.
AI that knows your plant
Ask natural-language questions over live and historical data. Ground answers with factory knowledge, schedules, and machine documentation.
Energy management
Track Significant Energy Uses, EnPI, and savings against baseline — practical tools for structured energy improvement.
Reports & alerts
Scheduled factory and financial reports with AI summaries, plus alerts by Email or Telegram so the right people stay ahead.
Live factory visibility
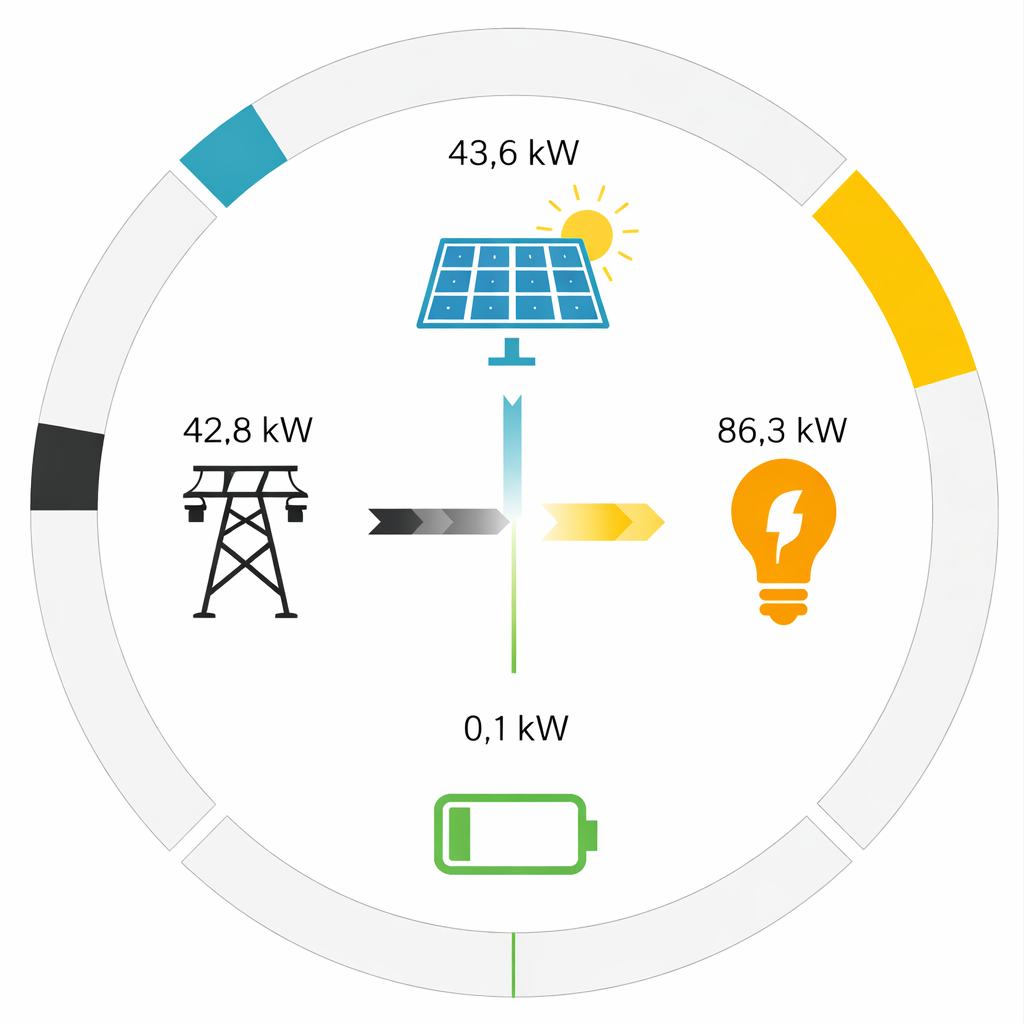
Consumption, demand, peaks, and power flow — so operations teams see the plant as it runs.
Consumption Today
LiveProduction & Demand
Factory Live Power Flow
Device-Specific Analysis
Detailed power, energy, and voltage analysis for each device with intelligent diagnostics
Zones Consumption & Production
Compare consumption and production across different factory zones
Zone Comparison
Photovoltaic Analysis
Real-time production monitoring and weather-based forecasting using your location data
PV Production
PV Production Prognosis
Production Insights
Instant Report Generation
Generate comprehensive reports in seconds - factory-wide or per-device analysis
Factory-Wide Report
Complete analysis of all devices, consumption patterns, production metrics, and energy efficiency across your entire factory.
Per-Device Report
Detailed analysis for individual devices including power, energy, voltage metrics, and performance diagnostics.
Flexible Time Ranges
Generate reports for any time period - hourly, daily, weekly, monthly, or custom date ranges. Compare periods and track trends.
Built for industrial workflows
Ingest from Modbus and MQTT gateways. Deliver alerts and reports through Telegram and Email. Export analysis to Excel when your team needs it offline.



Trusted in the field
Energy teams use Jaghleh to see clearly and act faster.

Michaelshof GmbH
Sustainable agriculture and energy solutions
"Jaghleh has revolutionized how we monitor and optimize our energy systems at Michaelshof. The real-time insights help us manage our agricultural operations more efficiently, and the AI-powered analytics have enabled us to reduce energy costs significantly while maintaining optimal production levels."
FAQ
Straight answers for energy and operations teams evaluating Jaghleh.
Plans for every facility
From commercial buildings to industrial plants. Book a demo and we will recommend the right fit.
Basic
Recommended for commercial buildings
- ✓Energy Balance Design
- ✓Monitoring dashboard updates every 15 minutes
- ✓Basic device analytics
- ✓2 users included
- ✓Up to 20 connected devices
- ✓Email alerts & notifications
- ✓Email support (48h response)
- ✓Daily, weekly, and monthly automated reports
Intelligent
Recommended for industrial facilities
- ✓Everything in Basic
- ✓All measurements (e.g. kW, kWh, V, A, VA, kVA, Hz, P.F., etc.)
- ✓Monitoring dashboard updates every 1 minute
- ✓3 users included
- ✓Up to 30 connected devices
- ✓AI extra chat assistant ($30/month usage included)
- ✓Advanced analytics & forecasting
- ✓Priority support (24h response)
Premium
Recommended for industrial facilities with maintenance and asset integration
- ✓Everything in Basic
- ✓All Intelligent plan features; AI chat assistant ($40/month usage included)
- ✓Monitoring dashboard updates every 10 seconds
- ✓4 users included
- ✓Up to 40 connected devices
- ✓Dedicated account manager
- ✓Custom AI model training
- ✓Smart machines integration with AI (up to 15 machines)
- ✓Custom integrations development
- ✓Priority support